Introduction
The Folding Test of Unimodality remains a statistical tool, so making a R implementation seemed relevant for us.
Our package Rfolding has been published on CRAN on september 2018. Henceforth developpers can get and use it more easily!
Installation
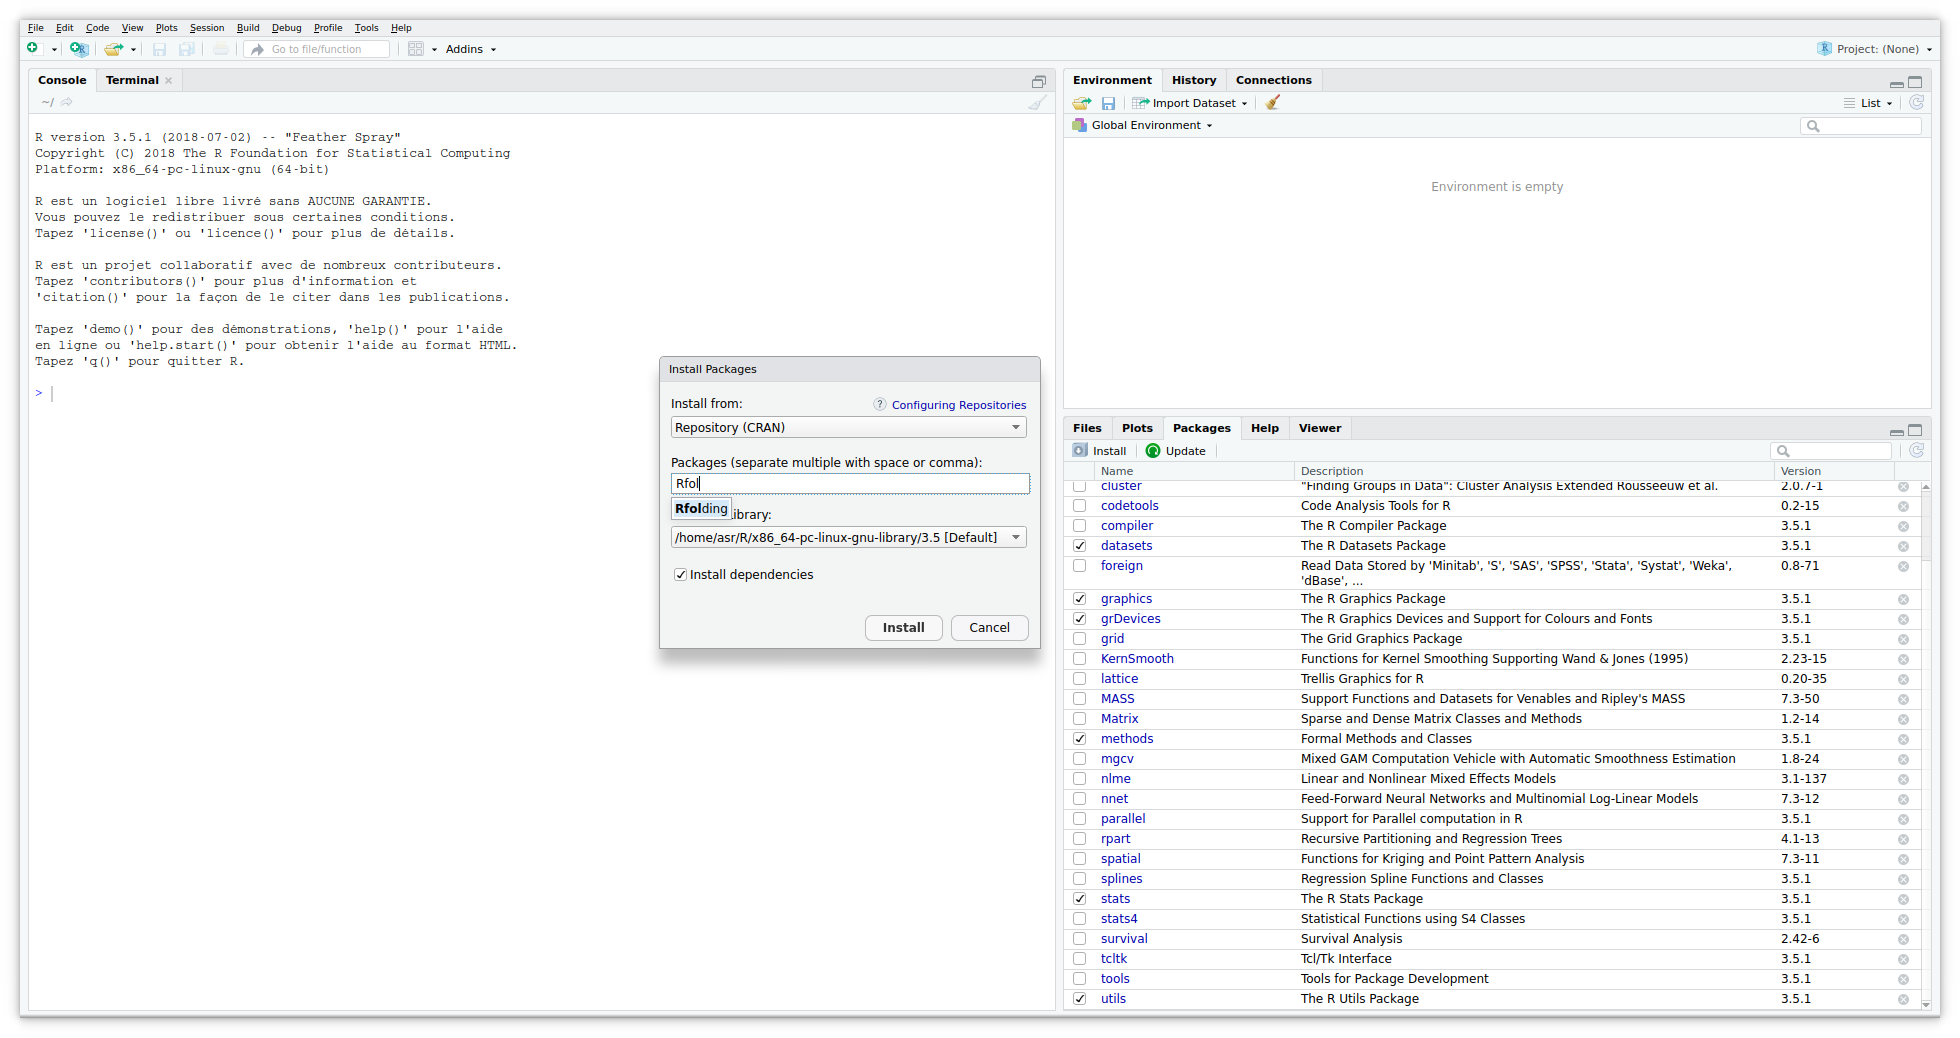
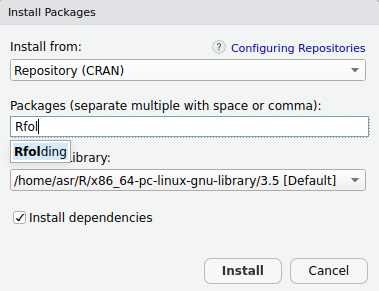
RStudio
Most of the R developpers are likely to work with RStudio. Thanks to its toolbox you can quickly download the package.
R console
On R console you can also install it through the following command
> install.packages("Rfolding")
Getting started
The R package is quite lightweight but embeds everything to perform the FTU on a dataset. The main function is the following:
folding.test <- function(X)
It needs a $n\times d$ matrix ($n$ observations in dimension $d$) as input and returns 3 elements:
-unimodal (TRUE or FALSE): the output of the test
-pvalue (float): the significance of the test
-Phi (float): the folding statistics
A basic example is given below
> n = 10000 # number of observations
> d = 3 # dimension
> mu = c(0,0,0) # mean
> Sigma = matrix(c(1,0.5,0.5,0.5,1,0.5,0.5,0.5,1), ncol = d) # covariance matrix
> X = mvrnorm(n = n, mu = mu, Sigma = Sigma) # Random sample from multivariate gaussian distribution
> m = folding.test(X) # perform the test
> m # output
$unimodal
[1] TRUE

$pvalue
[1] 0.0001220703

$Phi
[1] 3.07955
This function does everything but you can do the same thing step-by-step. First you can compute only the folding statistics
> Phi = folding.statistics(X)
> Phi
[1] 3.07955
We naturally notice that $\Phi>1$ so the distribution is rather unimodal (of course, it is drawn from the normal law!). Then, with $\Phi, n$ and $d$ we can compute the p-value:
> pvalue = folding.test.pvalue(Phi, n, d)
> pvalue
[1] 0.0001220703
If you want to investigate deeper, you can also compute the folding pivot through the function pivot.approx.
> S = pivot.approx(X)
> S
[1] -0.022377052  0.036734302  0.009282583
In this case we notice that the pivot is quite close to the mode. This phenomenon commonly occurs in the unimodal case.