12 minutes
Fancy Threat Intel’ with Cowrie/MySQL/Grafana stack
We all dream of this world map with cyber attacks between countries like this one or the one of Kaspersky. In this post, we will try to do threat intelligence at our modest level. We will consider a basic system open on the Internet, in the grip of cyber-attackers. In this context, we will collect attacks information so as to make a fancy dashboard to visualize what is going on.
We will use Cowrie to draw attackers’ attention (ssh honeypot), MySQL to store the collected data and Grafana to build a dashboard.

Context
In this basic threat intel’ experiment, we assume having a headless system with a public IP (SERVER_IP) and a domain name (DOMAIN_NAME). We can connect to the server through ssh.
We will first install Cowrie, then MySQL and finally Grafana. Cowrie is a honeypot which will listen on SERVER_IP:22. MySQL will only listen on localhost while Grafana will listen on SERVER_IP:30003.
Cowrie
Cowrie is a common ssh honeypot aimed to log connection attempts. In particular, we will focus on retrieving the user/password used and also the IP of the attacker.
Several tutorials exist to install cowrie. I have mainly been inspired by this one.
Before installing cowrie
To be a nice system to attack, we have to ensure that our honeypot will listen on port 22. So, as you probably have a ssh server, be sure it is listening on a different port (check /etc/ssh/sshd_config).
...
# The strategy used for options in the default sshd_config shipped with
# OpenSSH is to specify options with their default value where
# possible, but leave them commented.  Uncommented options override the
# default value.

Port 10022
#AddressFamily any
#ListenAddress 0.0.0.0
#ListenAddress ::
...
Some dependencies are required before installing cowrie. Sorry, it uses python2.7 which will be soon deprecated.
$ sudo apt install git python-virtualenv libssl-dev libffi-dev build-essential libpython-dev python2.7-minimal
Finally, we need to create the cowrie user. Its home folder will host the logs. However, in my case, I have not so much memory in /home, so I will put everything in another folder, namely /data. So cowrie’s home will be at /data/cowrie.
$ sudo adduser --home /data/cowrie --disabled-password cowrie
It may ask you some useless extra information about the user.
Getting sources
Now, let us take the cowrie identity to download the honeypot files.
$ sudo su cowrie
$ cd /data/cowrie
$ git clone https://github.com/micheloosterhof/cowrie
Data are in /data/cowrie/cowrie folder. In this folder, we will create a virtual environment (to avoid installing further python packets on the system).
$ cd cowrie
$ virtualenv cowrie-env
Running virtualenv with interpreter /usr/bin/python2
New python executable in /data/cowrie/cowrie/cowrie-env/bin/python2
Also creating executable in /data/cowrie/cowrie/cowrie-env/bin/python
Installing setuptools, pkg_resources, pip, wheel...done.
Then, we enter in the virtual environment to download some requirements.
$ source cowrie-env/bin/activate
(cowrie-env) $ pip install --upgrade pip
DEPRECATION: Python 2.7 will reach the end of its life on January 1st, 2020. Please upgrade your Python as Python 2.7 won't be maintained after that date. A future version of pip will drop support for Python 2.7.
(cowrie-env) $ pip install -r requirements.txt --upgrade
...
(cowrie-env) $ deactivate
Configure
Let us recall that we are in the /data/cowrie/cowrie folder. The cowrie config is located in etc/ subfolder. Let us have a look.
$ cd etc/
$ cp cowrie.cfg.dist cowrie.cfg
Many things can be changed in cowrie.cfg, but we will focus on the most important.
Listening port
In the cowrie.cfg we have especially the port cowrie will listen.
# Endpoint to listen on for incoming SSH connections.
listen_endpoints = tcp:2222:interface=0.0.0.0
So cowrie is going to listen on tcp port 2222. This is not very interesting to make our system scanned by bots. Several solutions exist.
Not recommended
Change 2222 to 22 in the config file and run cowrie as root (no, don’t do that).
Add bind capability
Change 2222 to 22 in the config file and add bind capabilities to python executable (linux capability CAP_NET_BIND_SERVICE). As your classical user:
$ sudo setcap cap_net_bind_service=+ep /data/cowrie/cowrie/cowrie-env/bin/python2
Authbind
(see here)
iptables
Finally, you can redirect the port 22 with iptables. As your classical user:
$ sudo iptables -t nat -A PREROUTING -p tcp –dport 22 -j REDIRECT –to-port 2222
I have tried iptables and capabilites methods. It works well in both cases.
Accepted connections
Cowrie does just log connection but also event about what the attackers do if he manages to connect. WTF!? Don’t worry, it is a kind of sandbox. Nowadays, you can configure the accepted credentials through the etc/userdb.txt file (copy userdb.example to userdb.txt before). In my case I have not given any access.
Start cowrie
Finally you can start cowrie (the first line is to change the user to cowrie):
$ sudo su cowrie
$ cd /data/cowrie/cowrie
$ ./bin/cowrie start

Join the Cowrie community at: http://bit.ly/cowrieslack

Using default Python virtual environment "/data/cowrie/cowrie/cowrie-env"
Starting cowrie: [twistd   --umask=0022 --pidfile=var/run/cowrie.pid --logger cowrie.python.logfile.logger cowrie ]...
Eventually you can check it works.
$ ./bin/cowrie status
cowrie is running (PID: 19133).
$ ss -alt
State  Recv-Q Send-Q Local Address:Port Peer Address:Port
LISTEN 0      50           0.0.0.0:ssh       0.0.0.0:*
For the moment you can stop cowrie. We will have a look on some of its options later.
CAAS: Cowrie As A Service
To my mind, managing cowrie is not user-friendly enough. We have to log as the cowrie user and launch /data/cowrie/cowrie/bin/cowrie start. Why not using a systemd service file? Let us create the file cowrie.service in the folder /usr/lib/systemd/system/.
[Unit]
Description=COWRIE: the famous ssh honeypot!
Requires=mysql.service

[Service]
User=cowrie
ExecStart=/data/cowrie/cowrie/bin/cowrie start
Restart=on-failure

[Install]
WantedBy=multi-user.target
Now we just have to do:
$ sudo systemctl daemon-reaload
$ sudo systemctl start cowrie
If you check the service (sudo systemctl status cowrie), it is actually idle… Why? The file /data/cowrie/cowrie/bin/cowrie is in fact a shell script which manage and daemonize the real underlying program. To solve the problem, we need to change a variable at the beginning of the file:
...
DAEMONIZE="-n"
...
Now you can start your service (even enable it at boot time)
$ sudo systemctl start cowrie
$ sudo systemctl enable cowrie
MySQL
We will use MySQL to store the cowrie logs. First we set up a MySQL server and then we configure cowrie to send logs to the database. Many of these steps are detailed in /data/cowrie/cowrie/docs/sql/README.rst.
Requirements
First let us download the mysql utilities.
$ sudo apt install mysql-server mysql-client mysql-common libmysqlclient-dev
Configuration
First you can start the secure installation of mysql. It helps to remove some useless (and insecure) features.
$ sudo mysql_secure_installation
Then you can add a cowrie user, a database just for him (and all privilege on it).
$ sudo mysql
mysql> CREATE USER 'cowrie'@'localhost' IDENTIFIED BY 'cowrie';
mysql> CREATE DATABASE cowrie;
mysql> GRANT ALL PRIVILEGES ON cowrie.* TO 'cowrie'@'localhost';
mysql> FLUSH PRIVILEGES;
After you can check that the connection with the cowrie’s account is ok
$ mysql -u cowrie -p
Enter password:
Welcome to the MySQL monitor.  Commands end with ; or \g.
...
Back to cowrie
Cowrie can send logs to a mysql database. First we have to add a python package (to the virtual environment obviously):
$ sudo su cowrie
$ cd /data/cowrie/cowrie
$ source cowrie-env/bin/activate
(cowrie-env) $ pip install mysql-python --upgrade
Then, the config file of cowrie (/data/cowrie/cowrie/etc/cowrie.cfg) must be modified as follows (according to your MySQL installation).
...
# MySQL logging module
# Database structure for this module is supplied in docs/sql/mysql.sql
#
# MySQL logging requires extra software: sudo apt-get install libmysqlclient-dev
# MySQL logging requires an extra Python module: pip install mysql-python
#
[output_mysql]
enabled = true
host = localhost
database = cowrie
username = cowrie
password = cowrie
port = 3306
debug = false
...
Now, the database scheme required by cowrie must be loaded in MySQL:
$ cd /data/cowrie/cowrie/docs/sql
$ mysql -u cowrie -p
Enter password:
...
mysql> USE cowrie;
mysql> source mysql.sql;
mysql> show tables;
+------------------+
| Tables_in_cowrie |
+------------------+
| auth             |
| clients          |
| downloads        |
| input            |
| keyfingerprints  |
| params           |
| sensors          |
| sessions         |
| ttylog           |
+------------------+
mysql> EXIT
Grafana
Installation
Some details can be found on the grafana website. Unfortunately, you cannot use apt directly to get it, so you have either to download it manually or add their apt repository (see below).
$ sudo nano /etc/apt/sources.list.d/grafana.list
Add the following line:
deb https://packages.grafana.com/oss/deb stable main
To install singed packages:
$ curl https://packages.grafana.com/gpg.key | sudo apt-key add -
Then install it!
$ sudo apt-get update
$ sudo apt-get install grafana
Configuration (HTTPS)
Before doing fancy visualizations with Grafana, we need to set up a bit of security. Actually, everything is local: cowrie listens on port 22 but this is a sandbox (besides we do not accept any connection in this case) and MySQL is listening on localhost.
Let us recall that we are headless so Grafana is likely to be our single entry point from the internet. As it has a full HTTP API, we first set up HTTPS, and then we create fancy dashboards.
Naturally, we will use Certbot to generate SSL certificates. We can add the cerbot ppa on our system so as to install it.
$ sudo add-apt-repository ppa:certbot/certbot
$ sudo apt update
$ sudo apt install certbot
With certbot we can easily create a certificate for our DOMAIN_NAME:
$ sudo certbot certonly --standalone -d DOMAIN_NAME
...
IMPORTANT NOTES:
 - Congratulations! Your certificate and chain have been saved at:
   /etc/letsencrypt/live/DOMAIN_NAME/fullchain.pem
   Your key file has been saved at:
   /etc/letsencrypt/live/DOMAIN_NAME/privkey.pem
   Your cert will expire on 2019-04-28. To obtain a new or tweaked
   version of this certificate in the future, simply run certbot
   again. To non-interactively renew *all* of your certificates, run
   "certbot renew"
...
We have the materials to make the connection to Grafana encryted. Let us open the configuration file (/etc/grafana/grafana.ini). In particular we have to set the protocol to https, the port to 30003, the domain name and the certificate/key files.
...
[server]
# Protocol (http, https, socket)
protocol = https

# The ip address to bind to, empty will bind to all interfaces
;http_addr =

# The http port  to use
http_port = 30003

# The public facing domain name used to access grafana from a browser
domain = DOMAIN_NAME

# Redirect to correct domain if host header does not match domain
# Prevents DNS rebinding attacks
;enforce_domain = false

# The full public facing url you use in browser, used for redirects and emails
# If you use reverse proxy and sub path specify full url (with sub path)
;root_url = http://localhost:3000
...
# https certs & key file
cert_file = /etc/letsencrypt/live/DOMAIN_NAME/cert.pem
cert_key = /etc/letsencrypt/live/DOMAIN_NAME/privkey.pem
...
If you start your server, you may have an error: grafana cannot read your certificate files (cert/key). Actually, only root can read them while the Grafana service (file /usr/lib/systemd/system/grafana-server.service) run as grafana user (and grafana group). Two solutions exist (see the following paragraphs)
Lazy and ugly
You give read + exec access to all for the folders /etc/letsencrypt/live and /etc/letsencrypt/archive (the most insecure)
$ sudo chmod -R a+rw /etc/letsencrypt/live
$ sudo chmod -R a+rw /etc/letsencrypt/archive
Boring and secure
You create a specific group for ssl stuff (e.g. ssl-users) and add grafana to it.
$ sudo groupadd ssl-users
$ sudo usermod -aG ssl-users grafana
$ sudo chown -R root:ssl-users /etc/letsencrypt
$ sudo chmod -R g+rw /etc/letsencrypt/live
$ sudo chmod -R g+rw /etc/letsencrypt/archive
With the second solution, the problem is not solved yet. Actually, the service runs with the group grafana (and not ssl-users), so we have to remove it (in /usr/lib/systemd/system/grafana-server.service):
[Unit]
Description=Grafana instance
Documentation=http://docs.grafana.org
Wants=network-online.target
After=network-online.target
After=postgresql.service mariadb.service mysql.service

[Service]
EnvironmentFile=/etc/default/grafana-server
User=grafana
#Group=grafana
Type=simple
...
When a service file is changed, we must reload them:
$ sudo systemctl daemon-reload
Damned! It creates a new problem: /etc/grafana is owned by root:grafana, so the daemon cannot read the config file… You must change to grafana:grafana:
$ sudo chown -R grafana:grafana /etc/grafana
We are done, you can check the status of the service:
$ sudo service grafana-server status
● grafana-server.service - Grafana instance
    Loaded: loaded (/usr/lib/systemd/system/grafana-server.service; disabled vendor preset: enabled)
    Active: active (running) since Mon 2019-01-28 12:43:54 UTC; 15min ago
    ...
Administration
Finally! We did it! Let us connect to https://DOMAIN_NAME:30003/:

Now, you can connect to Grafana. Default credentials are admin/admin, but Grafana ask you to change once logged in, so… DO IT!
Then, on the main dashboard, Grafana invites us to add a data source. So, let’s do this:
| Home dashboard | Data source selection |
|---|---|
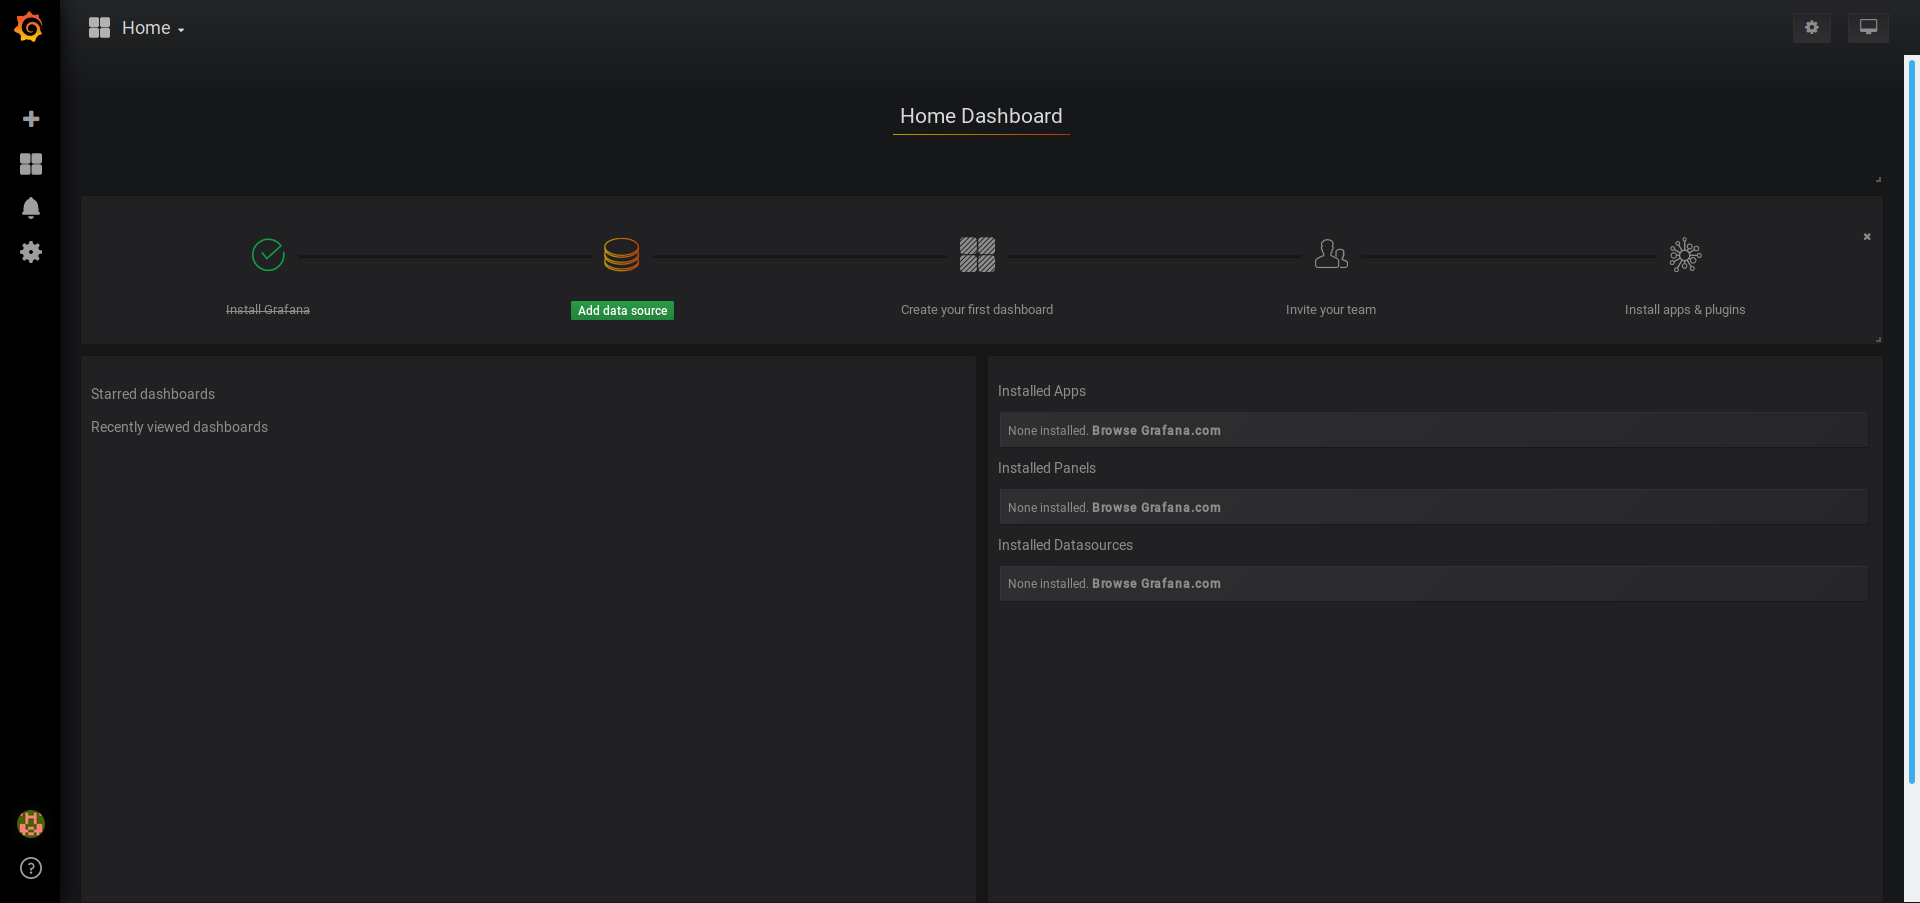 | 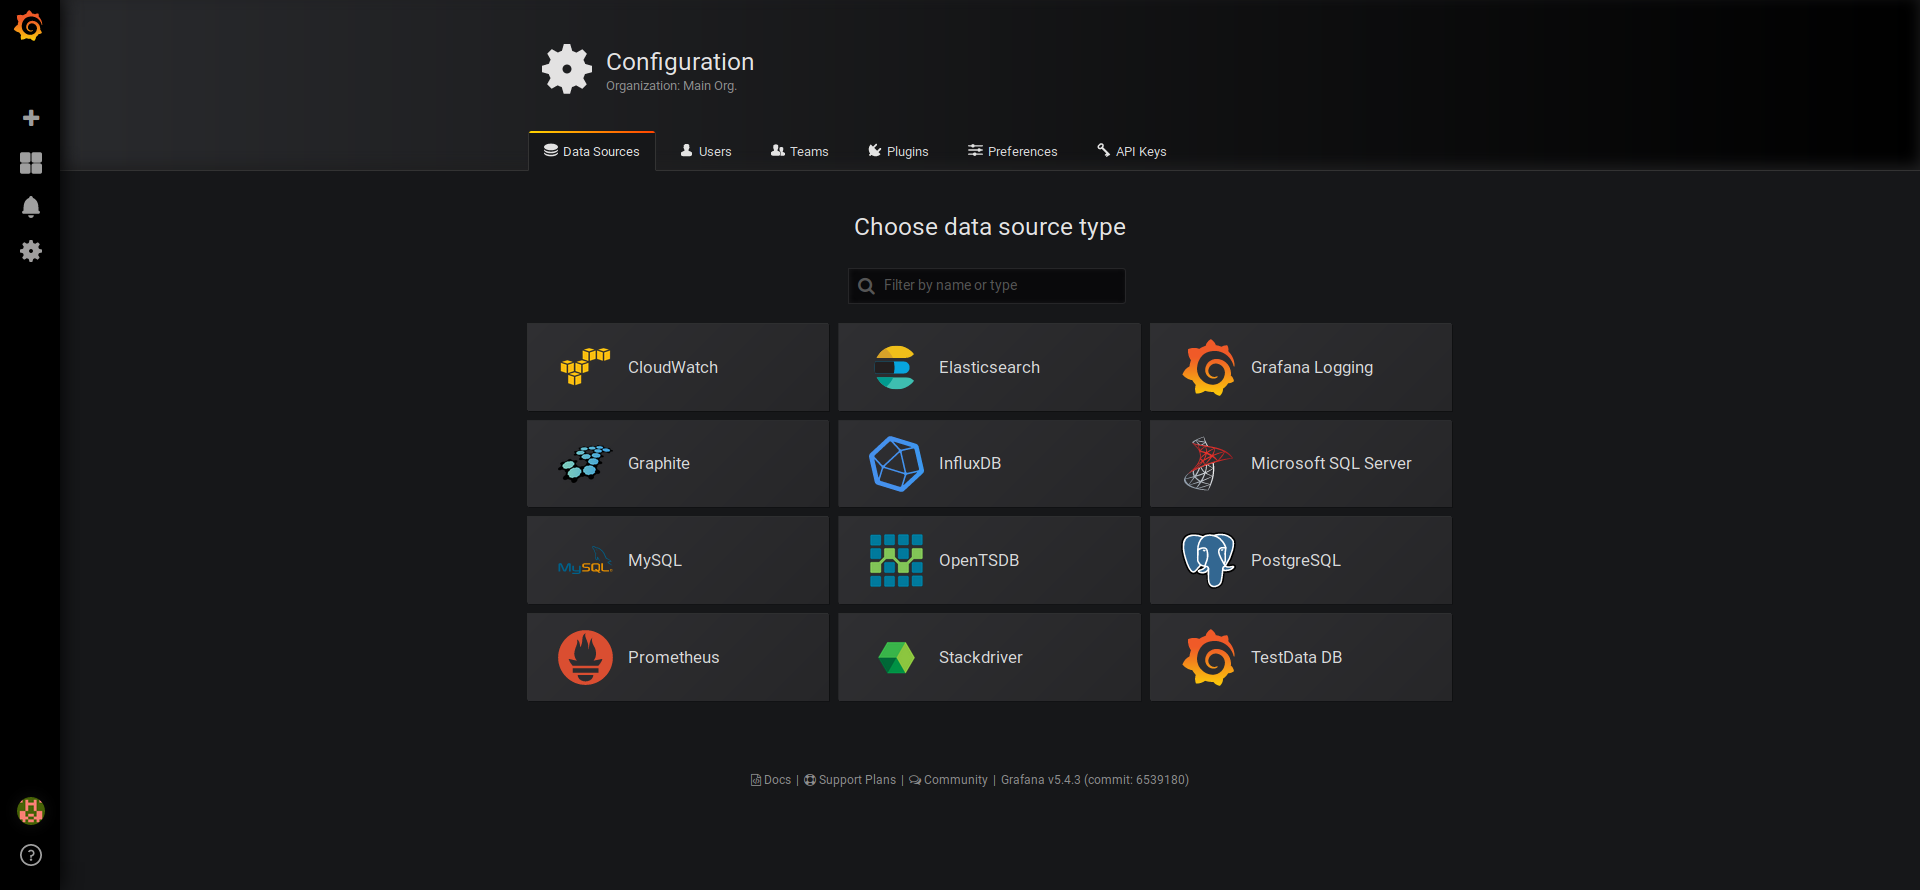 |
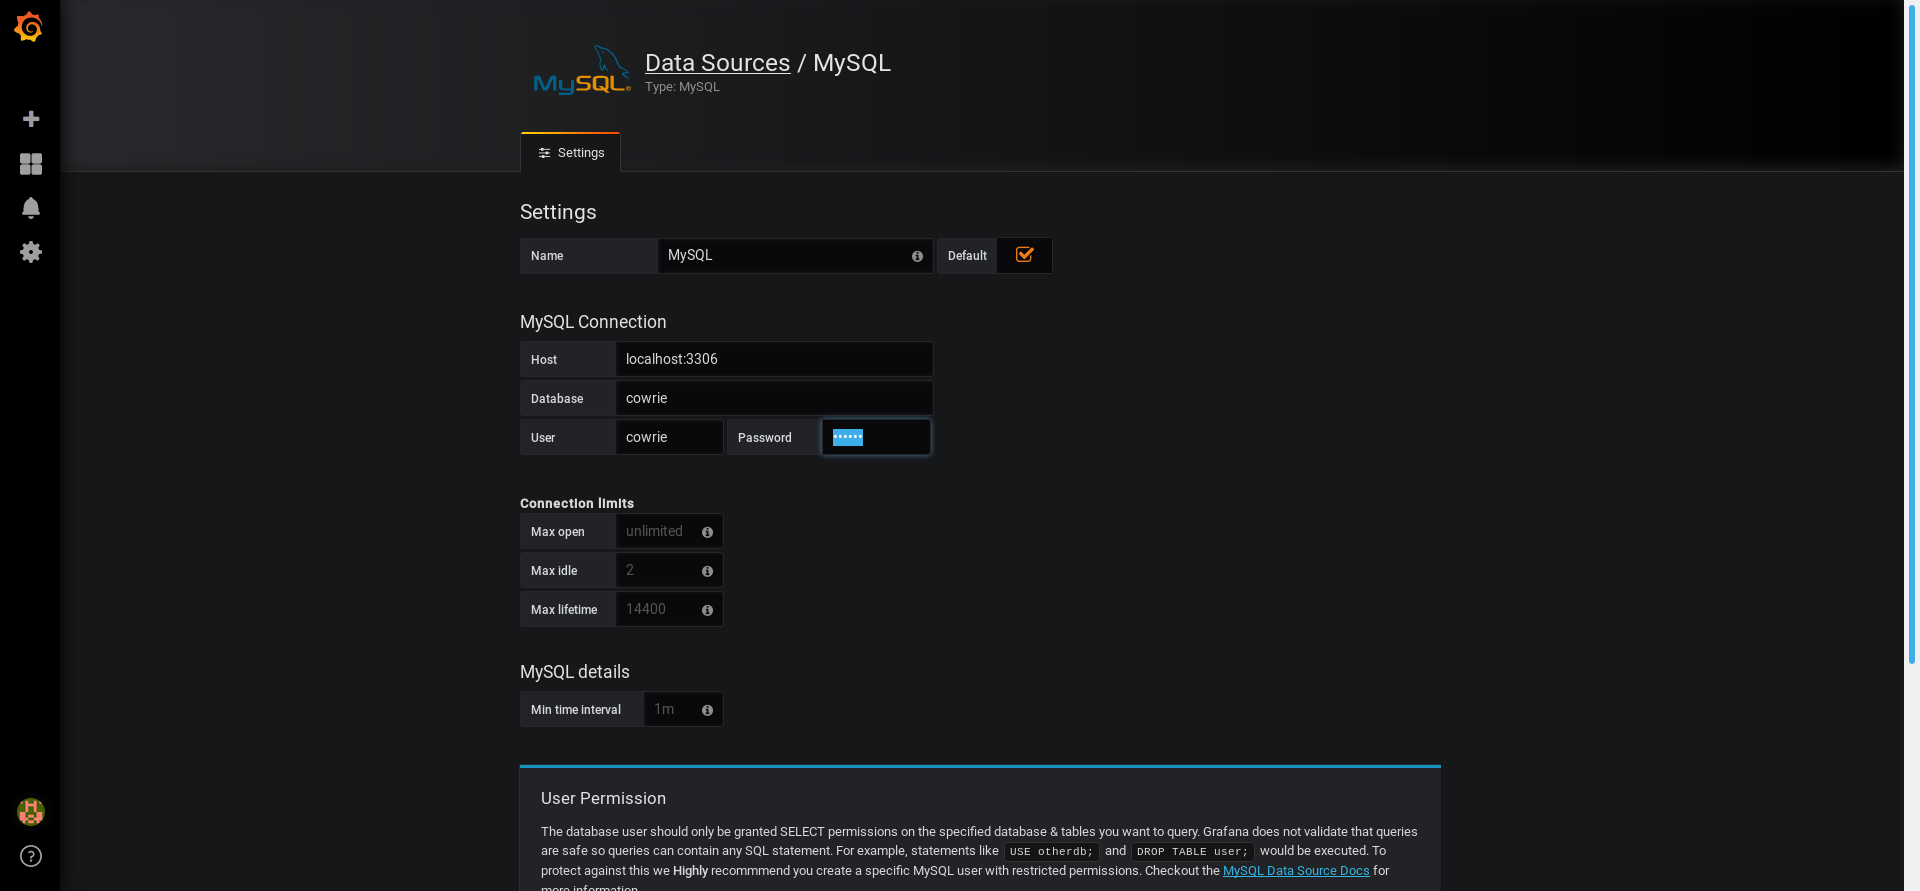
Naturally, we select MySQL and we fill the required information:
After that, we are ready to make a fancy dashboard with fancy panels to visualize what is going on in our cowrie honeypot!
First panels
Grafana have different built-in panels but you can get more through plugins. In particular we will use the “carpet-plot”, which will represent the number of ssh connection attempts, every hour, along time. We can download it through:
$ sudo grafana-cli plugins install petrslavotinek-carpetplot-panel
Once the plugin is installed, you must restart Grafana.
$ sudo service grafana-server restart
Last credentials
One interesting thing is to get the last credentials the attackers used to connect to our honey pot. A simple “Table” panel can do the job.
To configure the panel, you have to make the right SQL query. Here, this is not so complicated as these information are stored in the auth table of the cowrie database. You can either use the query interface or put the raw query (Toggle Edit Mode).
In my point of view, the interface is better to manage time queries/aggregations. If you want simple output (no time filter), the edit mode is easier. So let us use it:
SELECT timestamp,username,password from auth
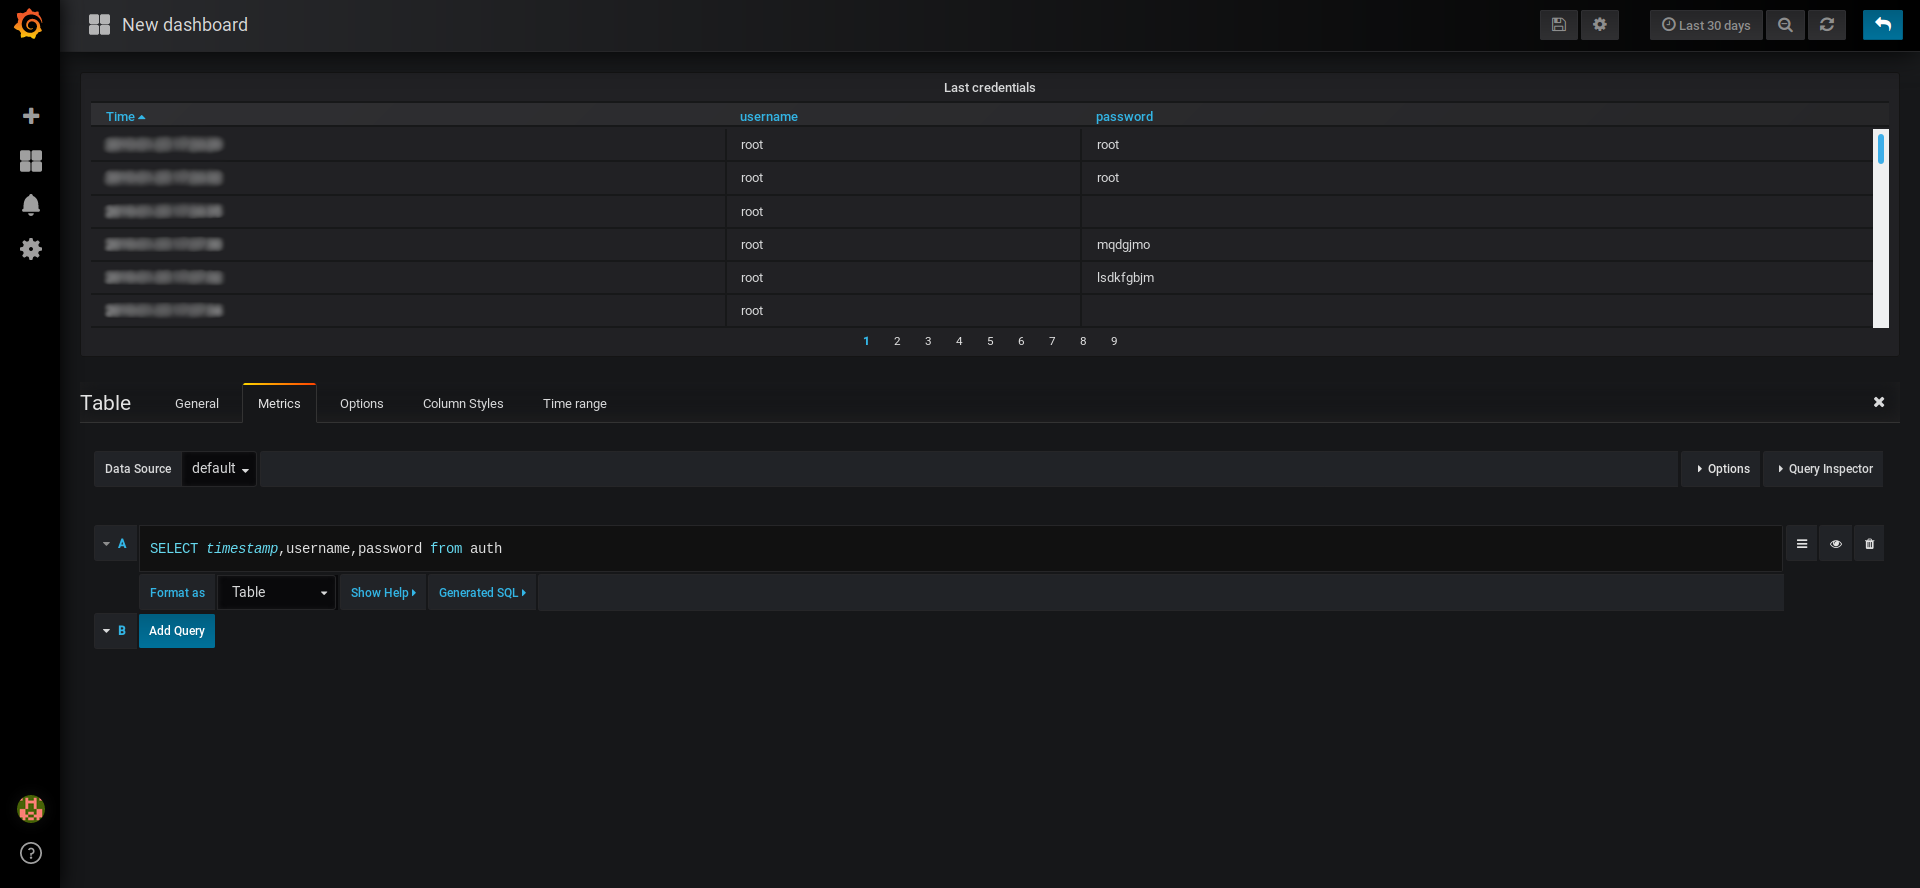
Now, you can configure further things like the title or the way to sort the data (descending time order in my case).
Number of unique IP addresses
The first panel is greedy, meaning that it has printed all the credentials since the beginning. However, Grafana is designed to work on sliding window. Here, we answer the following question: “How many distinct IP addresses have attempted to connect for the last x days?”, where x is a parameter you can tune on the top-right corner of the dashboard.
For that purpose, let us add a new “Singlestat” panel, designed to print a relevant value.
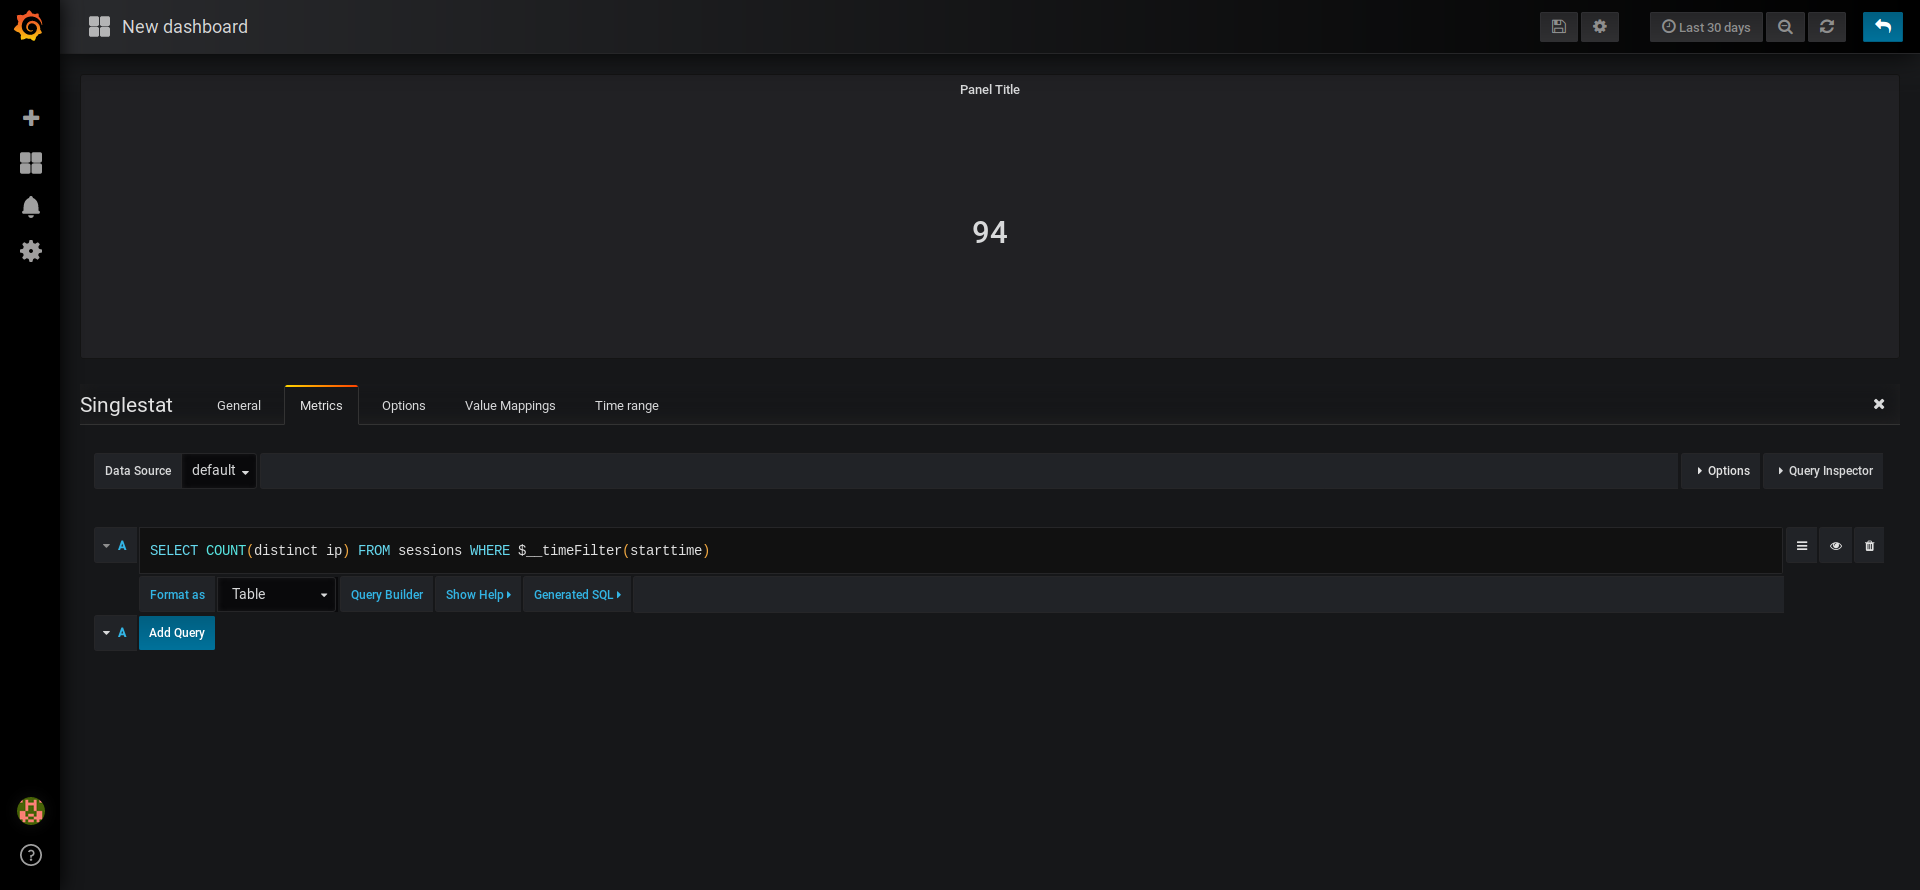
IP are stored in the sessions table.
Here, we have to count the distinct IP but only for the last x days. This filter is easily available through $__timeFilter. The whole command is then:
SELECT COUNT(DISTINCT ip) FROM sessions WHERE $__timeFilter(starttime)
Attacking periods
What time are we under attack? To go further in our threat intelligence experiment, we are going to use the “carpet plot” we downloaded previously.
Here, the query interface seems easier to use, especially if (like me) you are not mastering SQL.
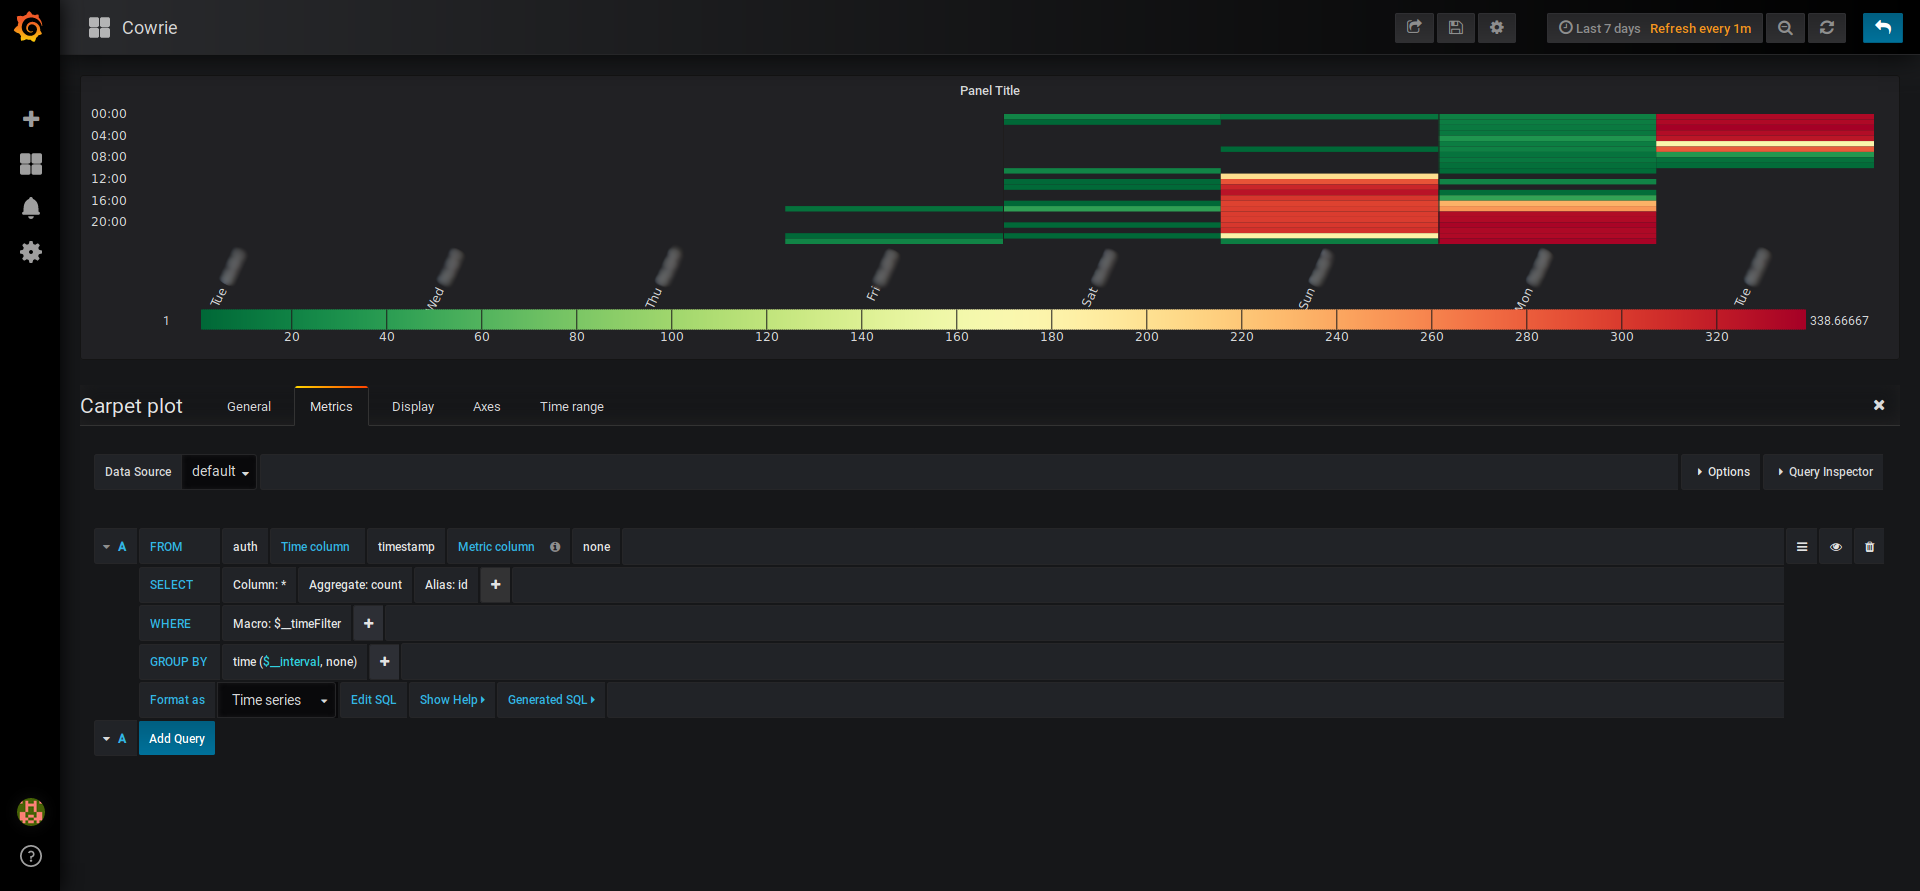
Naturally, you can change the title, the color palette etc. Grafana and its plugins are pretty good for customization.
I want the world map!
Obsiously, we want the map. Unfortunately, the Grafana plugin is not so easy to use with our information. I will do my best to find a simple solution to do it from our setup.
2503 Words
2019-01-25 00:00